on September 27, 2016
Every query tuner wants to explain exactly how much faster we made a query.
But sometimes SQL Server Management Studio adds noticeable overhead to the query duration. For relatively fast queries that return more than a few rows, just the overhead of displaying the results can skew your duration metric.

Spoiler, for those short on time: executing your queries from the SQL Sentry Plan Explorer client can be handy because it always discards results, shows you duration, CPU, reads, and writes, and will display a message if you mess up your TSQL and get a parsing error. It’s free, and it’s a client tool with no need to install anything on the SQL Server itself.
SQL Server Management Studio bloats duration a bit
I frequently use the command SET STATISTICS TIME ON to tell SQL Server to print information about how long my query took to the ‘Messages’ tab in SSMS. This is an easy, convenient tool to use interactively as you rewrite a query or tweak indexes in a test environment.
I typically look at the ‘CPU time’ metric when tuning instead of ‘elapsed time’ (duration). This can work well for tuning because you’re measuring how much more efficient you made the query in terms of CPU cycles.
But ‘CPU time’ isn’t perfect, and it can get a little weird for reporting results to users, because:
- If the query uses parallelism, CPU time can be higher than the duration – which may make the query seem “slower” than it actually is to anyone reading a report
- ‘elapsed time’ includes all the time that it takes to display the results in Management Studio, which is probably a different duration than it would take to return the results to an application server. If you’re just returning a few rows, this may be negligible– but once it gets into the thousands of rows, it can be very noticeable.
What about ‘discard results after execution’ in SSMS?
SSMS has a setting in the “Query” menu’s “Query Options” panel that tells it to throw away the query results.
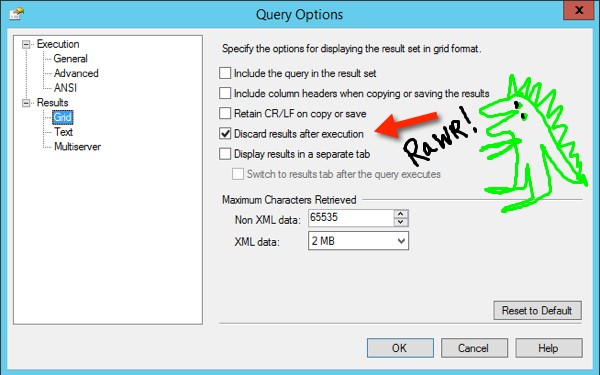
Unfortunately, this also discards everything that displays on the ‘Messages’ tab, too.
In other words, you won’t see your SET STATISTICS TIME information.
And worse, if you make a change to your TSQL so that it doesn’t even parse, you won’t see any errors. It’ll just look like it suddenly became very very fast. If you’re like me, that will fool you for a second, and you’ll be like, “I AM THE SMARTEST PERSON IN THE WORLD!”
Until you realize that your query is just silently failing.
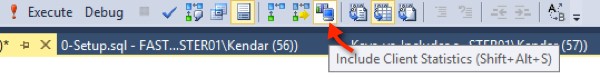
What about ‘Include Client Statistics’?
There’s a little button on the SSMS toolbar that tells it to start tracking some metrics for your session:
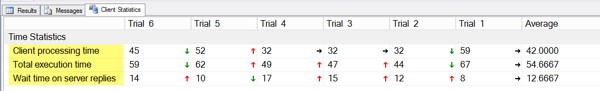
You can combine this with ‘discard results after execution’. Your client statistics won’t get discarded, and it will even track your average metrics across multiple runs of your query, like this:
I like the concept of this, but…
- I don’t love having to discard results after execution (because I fat-finger the TSQL a lot and would really like to see those parsing errors, thanks)
- I don’t have the option to see logical reads (which I could get with SET STATISTICS IO), and it doesn’t know about CPU time. It’s just measuring client statistics, like the name says.
And so I never find myself using Client Statistics much. If it was Server Statistics for the query, that’d be awesome! Oh well.
SQL Sentry Plan Explorer makes this a bit easier
I’ve been opening query plans in SQL Sentry’s ‘Plan Explorer’ tool for years, but I never ran a query from it until this week. I’d just never really thought about it before.
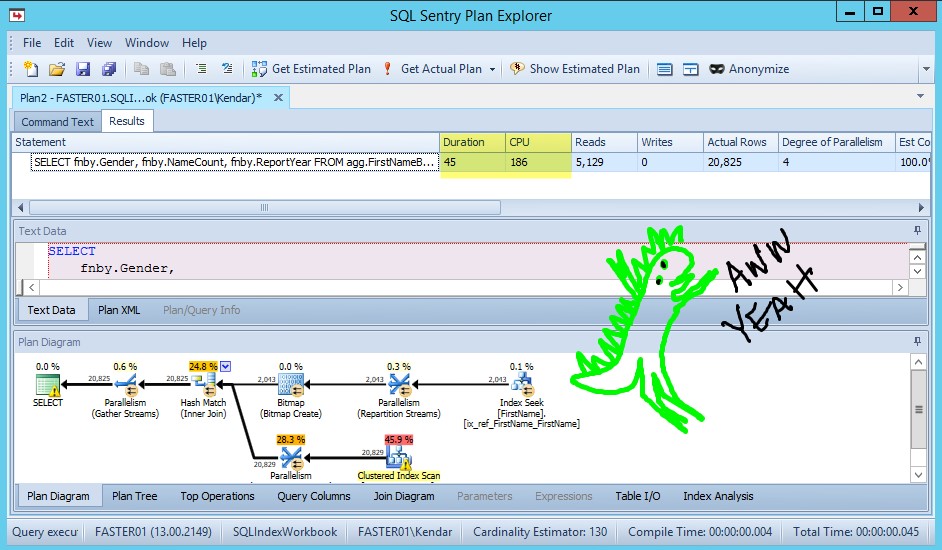
To run a query from Plan Explorer, click the ‘Get Actual Plan’ button. A pop up lets you know it’s going to discard the results, but it will really be running that query (so don’t go insert/update/delete/truncating if you don’t really mean it).
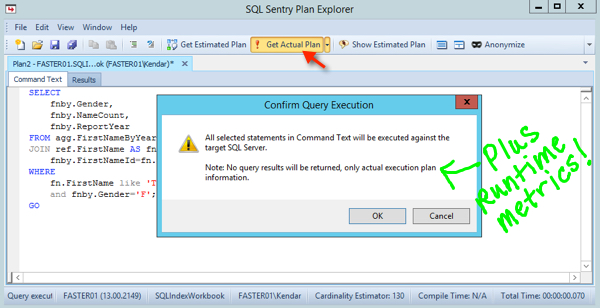
When the results come back, the first thing you’ll probably notice is a picture of the execution plan. But if you look up at the top of the window in the results pane, you can find Duration and CPU time there:
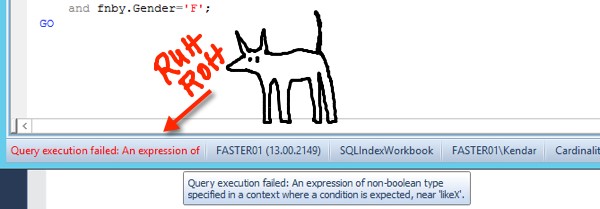
What if your query fails?
And if you’re like me, and you occasionally get a little too creative in your TSQL, it doesn’t just silently fail and tell you the query was fast. It’ll clue you into your error at the bottom of Plan Explorer:
I’m not breaking up with Management Studio
SQL Server Management Studio will still remain my primary client tool. It’s really great for general purpose use - that hasn’t changed. I’ll still use SET STATISTICS TIME for a lot of general purpose tuning: it’s quick, it’s easy, it’s built in.
For fine tuning queries were performance is really important, and where I want a more accurate view of duration while I’m looking at execution plans, Plan Explorer is super helpful.
Thanks for making it completely free, SQL Sentry!