on April 11, 2018
You know how they say “don’t sweat the small stuff”?
That’s good advice for lots of things, but when it comes to query tuning - I WANT TO KNOW MORE when something is inconsistent. I just can’t let it go. I go total X-Files: The Truth Is Out There.

The bright side of this habit is that it makes finding blog topics fairly easy.
I was measuring query performance at different degrees of parallelism
I set up a script to measure duration and wait statistics for a few queries. It followed this flow:
- Set a variable with the “starter” degree of parallelism (DOP)
- Begin a loop
- Clean up anything from the last round
- Record start time and snapshot of waits for the session from sys.dm_exec_session_wait_stats
- Run the test query at given DOP (using Dynamic SQL)
- Record end time and snapshot of waits for the session from sys.dm_exec_session_wait_stats
- Decrement the DOP
I was gathering the data to graph and show query durations along with the amount of CXPACKET and CXCONSUMER waits at different DOPs.
The first weird thing: inconsistent wait stats
Whenever I can, I run a test more than once. I was graphing my wait statistics, and I noticed that on different executions of the procedure, my parallelism waits varied.
Varied more than a small amount.
Luckily for me, I read the release notes for Cumulative Updates for SQL Server most of the time, and after noticing the variation I remembered FIX: CXPACKET and CXCONSUMER wait types show inconsistent results for some parallel query plans in SQL Server 2017.
I checked, and sure enough, my little cloud VM was on SQL Server 2017 CU3, and that fix is in CU4.
I patched to CU5 (latest and greatest for my little test instance, ya know), redid all my testing twice, and admired my now-more-consistent charts.
The second weird thing: inconsistent query duration
 I was getting consistent results for query duration when I ran the query in the script above, which started at a high degree of parallelism, and then went to low.
But I found that for one of my test queries, when I took the query and ran it in my own session to look at Query Time Stats in the execution plan, it took much longer.
For example, at MAXDOP 13:
- Duration was consistently 55-65 seconds in the looping script
- Running it in a session by itself, I was seeing durations of 2 minutes to 2 minutes 30 seconds
More than twice as long.
Why was it so much slower when I ran it in another session?
It wasn’t about cache/buffer pool reuse
I had plenty of memory on this instance, and I’d made sure to set ‘max server memory (mb)’ plenty high, but could something be causing me to do physical reads when I ran the query in my own session?
This made me realize that my test script wasn’t quite fair to the DOP that ran first – it might have to do physical reads where following queries made use of data in memory. This is a private test instance, so I changed the script to run everything with cold cache, by dropping clean buffers between runs.
I wasn’t getting a different query execution plan
I was getting the same plan with the same cost both in my “slow session” and in the script.
It wasn’t ASYNC_NETWORK_IO_WAITS
I was running everything from an SSMS instance on my laptop against a SQL Server on a VM in the Azure Cloud. Could I be getting some weird kind of latency on one session?
Nope. And my query wasn’t even returning a result set to my SSMS window – it was putting the results into a table in the cloud.
Was it the Dynamic SQL?
Could something about the Dynamic SQL be making it faster? Or had I made some sort of typo and the Dynamic SQL query was a little bit different in a way that made it faster?
Nope, it really was the same query, and the same plan. When I copied the longer script and adjusted the variables to only run for DOP 13 in my “slow” session, it was also slow.
Was it using STATISTICS TIME or STATISTICS IO?
I sometimes use these to measure queries, but in this case I wasn’t using them in either session.
Was it having Actual Execution Plans on?
Yes, it was.
This query was a reminder of the observer effect: watching something can change its behavior. In this case, “watching” the query by enabling actual execution plans made it take twice the duration.
I had actual plans enabled in my “slow” session, and I didn’t have them on in the session where I was measuring duration and wait statistics in the loop. (If you’ve ever accidentally left actual plans enabled when you’re running TSQL in a loop, you know how much SSMS doesn’t love that.)
I tested this a few different ways, including in another instance of SSMS local to the VM itself, and sure enough - actual plan drags this puppy down, although it’s a relatively simple query.
Was it only graphical plans?
I disabled graphical execution plans in Management Studio, then tested a few varieties of outputting actual plan info:
- SET STATISTICS XML ON - Actual plan information output as XML in a column named “Microsoft SQL Server 2005 XML Showplan”
- SET STATISTICS PROFILE ON - Actual plan information output as text across a variety of columns (screenshot below)
I tested these independently. Both of these had the same impact on the query as using the graphic execution plan - the query took twice as long.
I did feel kind of fancy looking at actual plan info in text format, though. We all know that hackers ALWAYS use text interfaces.
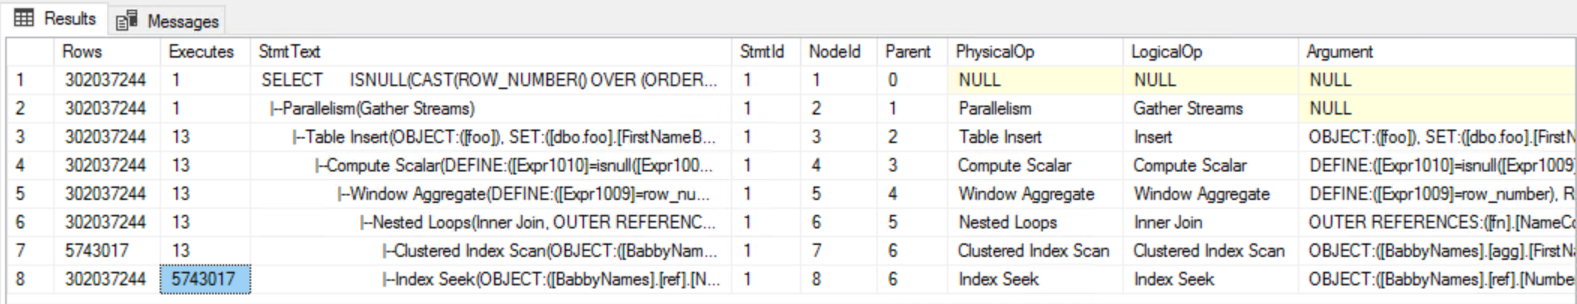 Kinda cool how execution count pops out in this view
What about ‘Live Query Statistics’?
I expected this to take a full three minutes, but it only took a bit longer than the ‘Actual Plan’ run in this case: 2 minutes 5 seconds.
Does this happen against different instances? At different DOPs?
I ran the same query against the same data on a local test VM on my MacBook Pro, which has 4 cores.
The duration at MAXDOP 4 on the MacBook Pro:
- No actual execution plans = 2:41
- Actual execution plans enabled = 2:50
Hmm, the discrepancy is much smaller on the small instance.
So I retested at MAXDOP 4 on the cloud VM. Note that this gets a different plan - similar shapes, but different costs (much more memory on that instance).
- No actual execution plans = 2:20
- Actual execution plans enabled = 3:07
To recap what I mentioned above, MAXDOP 13 on the cloud VM:
- No actual execution plans = 0:55
- Actual execution plans enabled = 2:00
Just for fun, MAXDOP 16 on the cloud VM (just in case you thought the issue was 13 being unlucky)
- No actual execution plans = 1:00
- Actual execution plans enabled = 2:14
Did I mention I’m compulsive about investigating this? MAXDOP 20 on the cloud VM (all its cores):
- No actual execution plans = 1:12
- Actual execution plans enabled = 2:10
Innnnnteresting. The impact of having actual plans enabled for this query is more pronounced on the cloud VM. The skew is greater at a higher DOP, although it’s not linear.
Actual plans are awesome, but make sure they don’t confuse your tuning process by secretly skewing your execution times!
There’s always overhead to using an actual plan.
Frequently it’s minimal, but sometimes it’s really significant - and the amount it varies may differ on different hardware, and at different degrees of parallelism.